Least Squares
This is an unexpected activity but it fits so well with the grade 11 objectives—understanding functions, working with quadratics, and it allows us to further our agenda of using contour diagrams to work in 3 dimensions.
Of course we need a precise measure of goodness of fit and that can lead to a great discussion. We want to choose the line that, in some sense, is the “as close as possible” to the set of points. But how are we to measure the “distance” of any particular line to the set of points?
What we use is the standard “least-squares” criterion. Calculate the vertical distance of each of the data points from the line, and add these up. We get what we call the SSQ of the line (the “sum of squares”). Each line will have its own SSQ and we want to choose the line for which this is the smallest.
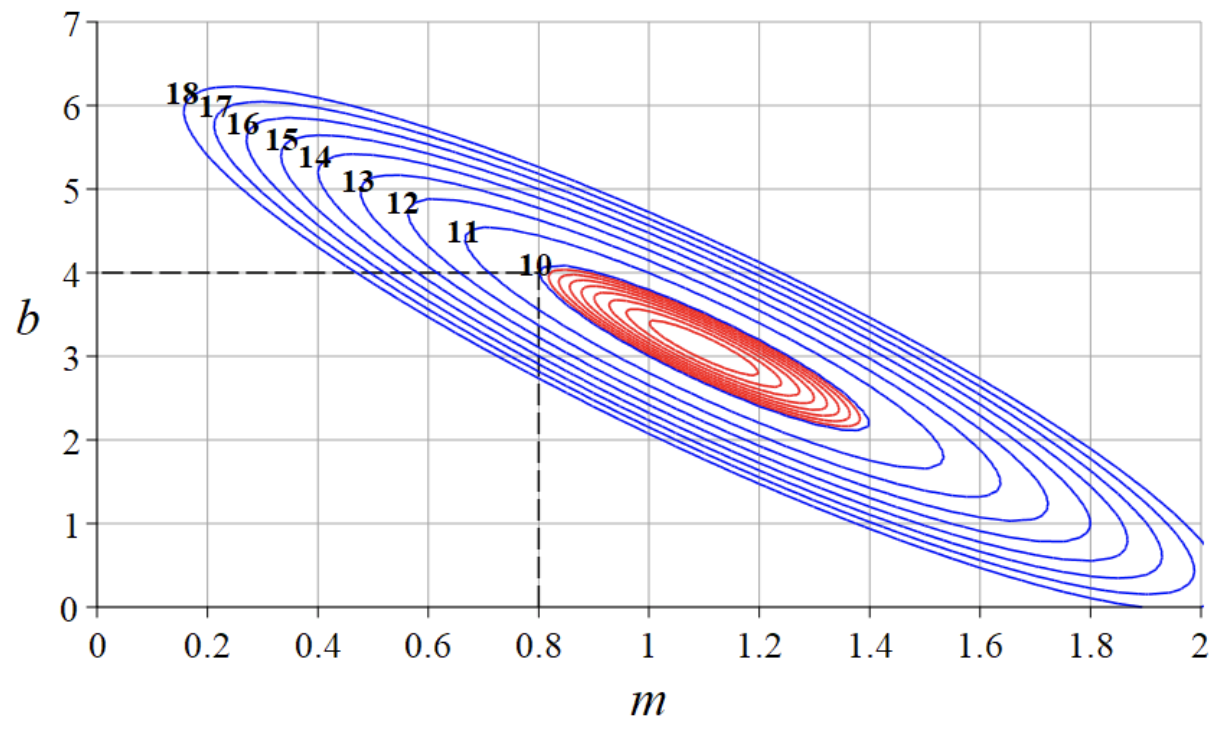
The line drawn at the right looks pretty good. It has y-intercept b = 4 and slope m = 4/5 and the students can calculate that it has SSQ = 10.
Can we do better? Well, feast your eyes on the diagram below. Every possible line belongs to a unique point in in m-b space, the line drawn at the right is clearly identified The contour lines give us the SSQ value of each point and thus of each possible line.


